Devso Blog
Latest news and developments from Devso, including progress updates on the development of Crash Catch (https://crashcatch.com) and future projects
Intermittent Connectivity Issues to Boardies IT Solutions - How We Diagnosed and Resolved
Chris Board
Dec 18, 2017 • 24 min readIntroduction
You may be aware, and you may have noticed the issue yourself, that we opened an incident status on our Status Pages at the beginning of Octoboer describing a potential intermittent connection issue. We said potential, because at the time we didn't know if it was true, or whether we were just getting a false positives (we'll get on to why we thought that a bit later on).
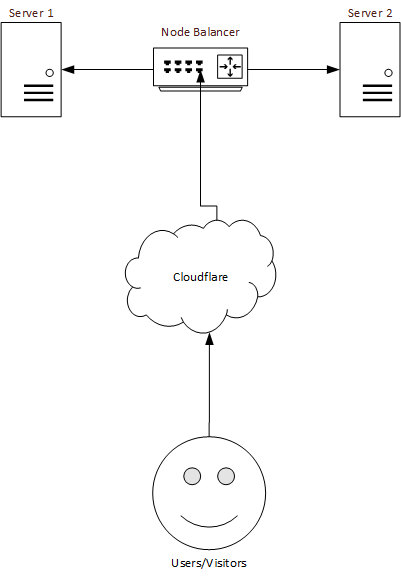
Our setup isn't overly complicated, we have two web servers and a load balancer which round robins the traffic to spread the load between the two.
The web servers are hidden behind a service called Cloudflare. Cloudflare does many things, but the basic gist of it is, they hide the website behind a proxy and provide the DNS for our domain. When you visit Boardies IT Solutions, the domain name is checked against our DNS within cloudflare, they then grab the data from the server and pass it back to the user who requested it, along with providing cached content, such as CSS and images so not everything always has to hit our server, they also provide security by ensuring that malicious traffic is blocked before it hits our server. They also provide DDoS (Distributed Denial of Service) mitigation in the event that someone attempts to send us a surge of traffic to make our website or APIs unavailable.
How we found there was an issue?
We hate to admit this, but we unfortunately had no clue there was an issue, and it was a bit of pot luck that we found it.
We've always had a service monitor that monitors the website uptime, server CPU and server memory utilisation. This service monitor however, never reported there was an issue - apart from in the past when we've had a complete failure when we originally only had 1 server so as far as we were concerned everything was OK.
Our service monitor then announced they were changing their service to a new plan and it out priced what we needed (and what we found was a rather complicated pricing model), so we started looking elsewhere. We looked at various companies, but we then came across Datadog.
We did some research and was really impressed with what kind of data could be collected to help diagnose issues, and, although we didn't know it at the time, this proved invaluable to try and work out where the problem was.
So, we went ahead and installed the agents on both of our servers (which was very simple) and set up some monitors and alerts. Initially, the main ones we set up were what we had with our original host, CPU, Memory, and then check the status of some URLs. The URLs we monitored were this one,
our main site and our support portal as well as a couple of other internal URLs for our access to certain areas and APIs. It was all installed, looked like all was well, and then we got a surprise.
Within a couple of hours of installing the datadog agent we started receiving alerts from both servers from the various URLs being monitored. Huh! what's going on.
This gave us multiple areas where the issue could be
- Datadog monitoring agents
- Either, or both of the servers
- The load balancer
- Access behind the Cloudflare proxy
- Cloudflare DNS issue
The invesigation begins
Our first point of call was that as we never had any alerts from the previous monitoring, the issue must have been datadog.
We reached out to datadog to get some help. Upon their investigation from the logs from the agent, the agent just received a connectivity timeout of 5 seconds (what our alert monitoring was set to) there was no issue with the agent itself. They pointed out the general differences and provided the area of the code on GitHub that does the HTTP GET request.
The main differences between our original monitoring and datadog, is the original company did an HTTP GET request to the URL being monitored from outside using their own servers every 5 minutes. The datadog agent itself does the HTTP GET request, so my server is the one doing the GET request but does it every 15 seconds. This then gave us another couple of points for consideration, as we're sending the same request every 15 seconds, could our hosting network think we're doing something suspicious and throttle the network connectivity, contributing to the timeout, or could it be the servers own DNS is having an issue resolving the domain name (they would be forwarding the request to cloudflare DNS and then coming back into the hosting provider, ino the load balancer, and then to one of the servers, maybe the one that originated the HTTP request from the agent, or it could hit the other server. So we now have two additional things that could be the culprit, so we now have 7 possibilities.
First thing to rule out, were the timeout alerts definetely true.
We created a PHP script making use of the CURL library to send an HTTP GET request, and write to a log file if one of two things happen, we either get a connection timeout, or we receive an non 200 OK HTTP Status Code. An sample of the our script is below.
<?php

while (true)
{
	executeTest("https://boardiesitsolutions.com"); //Uses Cloudflare
	executeTest("https://support.boardiesitsolutions.com"); //Uses cloudflare
	sleep(10);
}

function executeTest($url)
{
	$ch = curl_init();
	curl_setopt($ch, CURLOPT_RETURNTRANSFER, 1);
	curl_setopt($ch, CURLOPT_URL, $url);
	curl_setopt($ch, CURLOPT_USERAGENT, "BoardiesITSolutions_Timeout_Debug");
	curl_setopt($ch, CURLOPT_CUSTOMREQUEST, 'GET');
	curl_setopt($ch, CURLOPT_CONNECTTIMEOUT, 5);

	$result = curl_exec($ch);
	$httpcode = curl_getinfo($ch, CURLINFO_HTTP_CODE);
	if ($result === false)
	{
		writeError($url, 0, false, curl_error($ch));
	}
	else
	{
		if ($httpcode !== 200 && $httpcode !== 302)
		{
			writeError($url, $httpcode, true);
		}
	}
	curl_close($ch);
}

function writeError($url, $httpCode, $curlCompleted, $curlError = null)
{
	require_once 'DateTimeManager.php';
	$fh = fopen("error_log.txt", "a+");
	$currentDateTime = DateTimeManager::getFormattedDateTime('dd-mm-YYYY HH:ii:ss');
	if ($curlCompleted)
	{
		fwrite($fh, "$currentDateTime - Unexpected response for '$url'. HTTP Status: $httpCode\n");
	}
	else
	{
		fwrite($fh, "$currentDateTime - Curl failed for '$url' Error: $curlError\n");
	}
	fclose($fh);
}
The script started out just logging the Date/Time, time the out time and the HTTP status code if it wasn't a standard timeout, and during all the debug, extended to print out verbose logging from CURL in case it helped.
We ran the PHP script from both servers so it would test each of our URLs simulating how the datadog agent was working.
Within a couple of hours, both servers wrote to the log file stating connection timeouts. This pointed to us that datadog monitoring wasn't an issue, but was the issue only because the servers themselves were doing the HTTP request, and the hosting provider network was throttling as we are sending requests every 10 seconds (from the PHP script) or 15 seconds (from datadog agent), or was there an issue from outside as well.
I then ran our PHP/CURL script on a NAS at home and again, within a couple of hours started getting entries in the log indicating timeouts as well as HTTP Status code errors. Voila, we've now proved we do have a genuine connectivity issue, but why.
As mentioned, in the debug script we were getting connection timeout errors, but we also getting non 200 OK HTTP status codes. This striked us as a little odd, if we're getting a connection timeout, we shouldn't get an HTTP status code at all.
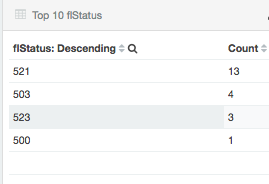
The status codes were were receiving were 520, 521 and 523. Upon some investigation, we found that 520, 521 and 523 are cloudflare specific HTTP status codes, the status codes described below (the origin server described below is referring to one of our servers):
520
A generic catch all status code when the origin server returned something unexpected, such as connection reset, exceeded header limit empty response from the origin, invalid HTTP response, or HTTP response missing a required header.
521
The origin server refused the connection on port 80 or port 443, this could be that Apache or nginx on our web server or the hosting provider is blocking connections from cloudflare.
523
The origin server is unreachable, possibily due to routing issues to the server, or the IP address that the DNS for the domain is pointing to isn't responding, possibly due to IP address error or origin server is not responding.
These 3 status codes all refer to cloudflare receiving a request to access my domain, they've tried to connect to our origin server to serve the request, yet they can't connect to our origin server.
This confirmed further, we definetely have a problem, we get timeouts from outside, and cloudflare are at times failing to connect.
This led us to wonder, because we're constantly sending the same request, both with the datadog agent and our script, is the hosting provider throttling us, or are cloudflare seeing it as we're behaving suspiciously and blocking the request to our origin server in attempt to protect our origin server from an attack.
We checked our Apache access and error logs, at each point that datadog or our PHP script triggered an alert, but neither logs showed Apache getting a request at the time of the timeout.
We reached out to our hosting provider and to cloudflare to try and get to the bottom of this connectivity issues.
Our hosting provider came back to us very quickly as usual (we've been with them for around 5-6 years, rarely an issue and if ever there was, their support has always been fantastic). They said they don't throttle the network so this definetely would be the cause, and they weren't aware of connectivity issues within the data centre where the servers are located, however, they were going to investigate further and check there wasn't specific issues with the load balancer, or the hosts where the servers are stored (our servers are VPS's (Virtual Private Servers)).
Cloudflare came back to us indicating they weren't having any issues, but provided a bar chart (below along with the error counts) that shows the connectivity errors during the course of a week in October and they haven't been blocking requests originiating from my servers IP or from my NAS.
Instead of taking it for granted that cloudflare weren't involved in this issue, we wanted to prove it for ourselves.
We did this first of all by disabling proxying requests through cloudflare to our main site so everything would always hit the origin servers, yet we continued to receive timeouts.
We then wanted to double check it wasn't cloudflare DNS, we had an old domain which we also added to our monitoring for testing the main site connectivity issues, we migrated the nameservers for this domain away from cloudflare and moved DNS to use our hosting providers DNS instead. We continued to receive timeouts, so this proved cloudflare wasn't the issue, and that the issue was somewhere either within our hosting provider or the servers themselves.
We needed to confirm if it was servers, or was it the load balancer causing an issue. We updated our DNS so that all requests, go straight to one of the servers, load balancer stopped receiving traffic and 1 server now taking all requests. We were still getting timeouts, we then did the same test but updated our DNS so all requests go to the second server instead, but we were still getting timeouts. This indicated the load balancer wasn't at fault, and the issue wasn't a particular server, both of them were having issues.
We also needed to prove was it a DNS issue within our hosting provider from the servers. In /etc/resolv.conf there were 3 DNS resolvers we could use.
This is where the dig command came in.
We ran the command dig boardiesitsolutions.com which then gave us something like the following output:
; <<>> DiG 9.9.4-RedHat-9.9.4-51.el7 <<>> boardiesitsolutions.com
;; global options: +cmd
;; Got answer:
;; ->>HEADER<<- opcode: QUERY, status: NOERROR, id: 13715
;; flags: qr rd ra; QUERY: 1, ANSWER: 2, AUTHORITY: 0, ADDITIONAL: 1

;; OPT PSEUDOSECTION:
; EDNS: version: 0, flags:; udp: 4096
;; QUESTION SECTION:
;boardiesitsolutions.com.       IN      A

;; ANSWER SECTION:
boardiesitsolutions.com. 80     IN      A       x.x.x.x
boardiesitsolutions.com. 80     IN      A       x.x.x.x

;; Query time: 0 msec
;; SERVER: 212.71.253.5#53(212.71.253.5)
;; WHEN: Thu Nov 16 18:58:21 UTC 2017
;; MSG SIZE  rcvd: 84
The dig command returns details about how the DNS was resolved include the query time, which was the only thing we were really interested in. We need to keep testing the DNS resolution to see if at times, resolution took longer than normal.
We therefore wrote a bash script to run the dig command and only return back the query time. We can get the query time, and check if the query time took longer we can write to a log file.
The script is as follows:
#!/bin/bash

cd /home/bits/debug
url=$1
output=`dig ${url} | grep "Query time"`
output=${output//";; Query time: "}
response=${output//msec}
curr=$(date "+%d-%m-%Y %H:%m:%S")
if [ $response -gt 1000 ]
then
        echo "${curr} - ${url} responded in ${response}ms" >> dns_log
fi
There is management script which is what running permanently and passes the URL to be checked to the script above to do the check.
After its ran the command extracted just the response time, it then checks if the response time greater than 1000ms (1 second) and then logs it.
When running this for a few hours, we did see DNS resolution take a second or so, this still should have been quick enough to not cause a timeout, but still longer than what's expected.
We then needed to confirm with the help of our hosting provider, was there a network issue somewhere along the route to the servers. From the home NAS we set up an MTR command and log the results. This was set up in a cronjob to run every minute to the various URLs, including URLs that didn't go through the cloudflare proxy so everything went to origin server.
output=$(/usr/sbin/mtr --tcp -P 80 -rw boardiesitsolutions.com); echo "$output" >> /var/log/mtr_bits_hostname.log`
The MTR command sends a request to the specified port to the URL. The MTR command is a more advanced tool to PING or TRACEROUTE where it shows a report detailing the hops taken from the source (where MTR is running) to the destination and overall network performance, such as packet loss and latency between each hop. A hop being each router or switch that has to receive the request and pass on to the next until it finally reaches the destination.
From a home network its fairly common to see some packet loss due to rate limiting, but it shouldn't continue on from each hop, which is what we looking for, did we see packet loss further down the route, and then continue to see packet loss up to the destination, which we didn't see, so this pointed it to not be the hosting provider network but we couldn't see any other cause.
You can find more info about how the MTR command works by going here
As a precaution, one of the servers was moved to another part of the hosting provider data centre as a test, then all traffic moved to that server, yet we still continued to receive timeouts.
At this point we were at a bit of a loss as to what the problem was, we started looking at datadog a bit more into what data we can check. We found there is a huge amount of data we can check. So we turned on some of the metric collection and created a couple of dashboard (views) of certain areas of interest.
From datadog, we started checking the metrics of the following:
- Packet error
- TCP Segment Retransmission
- TCP Listen Drops
- Listen Overflow Accept Buffer
- DNS Response Time
- HTTP Response Time
- TCP Response Time
- Average MySQL Query performance
This covered various aspects as to what we thought might be the problem, we thought maybe TCP response was too slow at times which explains why Apache wasn't showing anything, TCP retransmission showing network errors, average MySQL query performance in case there was some issue where our database was grinding to a halt and causing a long connection timeout (although this didn't make sense as Apache should have logged the request), even if it didn't manage to return a response quick enough.
Most of the above didn't show too much, DNS was quick, TCP response, MySQL performance was quick, but the one thing we did notice was TCP segment retransmissions was showing spikes as shown below.
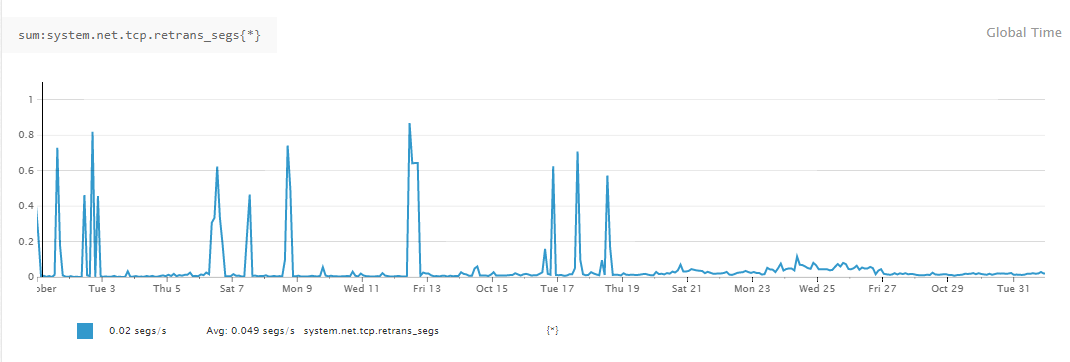
The spikes tied in with when we received a timeout so we did LAN traces on the servers. I'm not an expert in completely following LAN traces but looking at the traces around the time of us receiving a timeout, was showing the TCP Retransmissions.
We passed the traces on to our hosting provider in case they could spot anything else in the traces and while waiting, we installed a new web server with a new hosting provider.
We installed it exactly the same, same OS, same kernel, same services, same firewall configuration, same PHP and Apache configuration. We then moved all main traffic (such as the main site, support portal etc) to the new hosting provider server.
We left it running like that for a while, and we didn't receive any timeouts, this pointed us in the direction that the issue is somewhere within our hosting provider or our servers (but likely not our configuration as we've used the same configuration on the new server).
Our hosting provider from the traces discovered that the server is receiving a SYN packet but it isn't responding so its causing the requesting device to retransmit.
TCP is a fairly complex protocol but the gist of it is, say you want to view a web page. Your PC sends a request to the web server, but before it starts retrieving the page, a TCP handshake occurrs to connect to the server, once connected, the request is processed and sends the data back to the PC, then once done the connection between the PC and the server closes. The general flow is as follows:
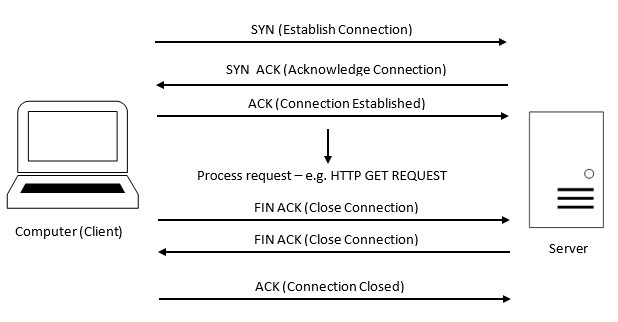
Instead what we were seeing in the trace was as follows:
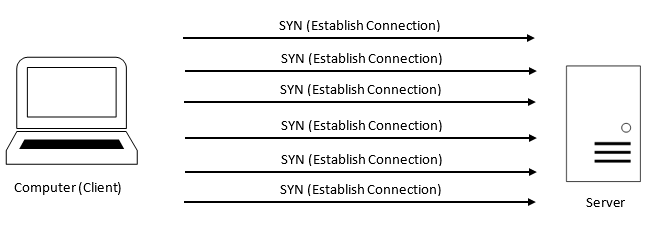
As you can see from above, the server keeps seeing SYN packets but never responds, until the client (in this case our NAS or the Datadog Agent) gave up the request.
Our hosting provider found us a link at serverfault.com.
This question is having the same issue as but when checking the value of net.ipv4.tcp_timestamps it was already turned off. When checking the server on our new hosting provider this was turned on.
We investigated a bit further into what the tcp_timstamps was. Its difficult to find a definitive answer as to whether its a good thing or bad thing to have on.
The good side is that it seems to provide enhancements to TCP performance, the downside is that if someone captured the traffic from the server, they'd be able to work out the servers uptime. That's not a massive issue in itself, but a potential hacker could, probably correctly assume, that when the server last rebooted, was likely when it was last pactched so could target the server with known vulnerabilties that were found after the last reboot time.
From our point of view this wasn't a problem, we take security seriously and we do everything within our power to ensure that servers aren't compromised, therefore we patch the servers on a regular basis.
So we turned on tcp_timestamps and monitored the situation. We were still receiving timeouts but possibily reduced. This is where the power of datadog came in. Datadog had been collecting the metric on the TCP retransmissions so after running with the TCP timestamps enabled we looked back at the metrics, and below is what we saw.
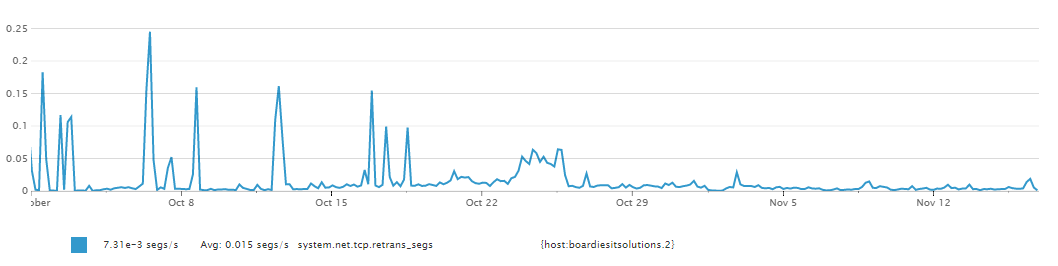
As you can see from the above line chart we were always seeing spikes, although still very low numbers, but after changing the TCP timestamp settings the graph stayed more a less flat with no spikes, things were looking better.
Unfortunately though, things weren't better, we were still seeing timeouts. I remember reading a few years ago that if a server/PC has IPv6 enabled but interacts with IPv4 it can cause problems. I unfortunately can't remember what those issues were, and if that is still the case but we thought we'd give it a try anyway. Unfortunately to no avail.
We were running out of ideas so checked our firewall on the servers. We use iptables for our firewall on the servers so was thinking the problem must be here.
How our firewall is configured is block all traffic and allow the ports we want to open. If the inbound traffic doesn't match one of the rules within the firewall, the packet is dropped. We therefore added a log to our iptables so that any packet that is dropped its logged. Then whenever we received a timeout alert we checked through the firewall log but found nothing was being dropped on the web server port (port 80).
We had now run out of ideas and this had gone on for far too long so we moved to a new hosting provider.
We set up two new servers with exactly the web configuration, same firewall configuration, same datadog configuration but expected that the issues we had was now resolved with the new hosting provider.
We went 2 days without a timeout so we thought, as expected, the issue is resolved and we closed our incident report on our status page.
The next day, we received another timeout from datadog. Why? How is this possible?
We started looking a bit more in to the datadog agent, which is what requests the website and raises an alert if a connection error occurs.
Our configuration for datadog is, if there is no response within 5 seconds, raise an alert. The agent code is open sourced on GitHub so we took a closer look at what it was doing and we ripped out just the HTTP request code and created our own version of the agent. It obviously wouldn't report anything to datadog, it just followed the HTTP request, but would log out the response time or log an error if a timeout occurrs.
Below is the code that we had for our simple little agent - the datadog agent, as my simple lightweight version are both written in Python.
import requests
import requests.exceptions
import socket
import time

url = "https://support.boardiesitsolutions.com"


while True:
    fh = open("output.txt", "a")
    try:
        payload = ""
        headers = {
            'connection': "Keep-Alive",
            'accept-encoding': "gzip, deflate",
            'accept': "text/html, */*",
            'user-agent': "Datadog Agent_Test/5.20.0"
            }

        start = time.time()
        sess = requests.Session()
        sess.trust_env = False

        response = sess.request("GET", url, auth=None, timeout=5, headers=headers, allow_redirects=True, verify=False)

        if response.status_code != 200:
            length = length = int((time.time() - start) * 1000)
            fh.write("ERROR: " + str(start) + " - Unexpected HTTP status code. Received: " + str(response.status_code) +
                " Time Taken: " + str(length) + "ms\n")
        else:
            length = length = int((time.time() - start) * 1000)
            fh.write(str(start) + " - Processed request in " + str(length) + "ms\n")
            if length >= 5000:
                fh.write("WARNING: " + str(start) + " - Response took 5 or more seconds to return\n")

        fh.close()
        time.sleep(5)

    except (socket.timeout, requests.exceptions.ConnectionError, requests.exceptions.Timeout) as e:
        length = int((time.time() - start) * 1000)
        fh.write("ERROR: " + str(start) + " - Connect failed after " + str(length) + "ms. Error: " + str(e) + "\n")
On a quick run on our dev server we proved it was all working but in this run everything returned within a few hundred milliseconds so everything looked OK.
We did an experiment where we put the timeout in the request to be extremely short so that it would trigger the timeout, while doing this we also monitored the apache access and error logs.
When running it now, the error that was returned for the timeout matched what we were seeing from datadog, but not only this nothing was logged in the apache access or error log.
It turns out that if the agent timeout parameter is triggered apache doesn't log anything. It looks like apache will only log the request if the request completes, as the datadog agent is timing out before the server completes the request, apache doesn't log it. Whether this is normal, or whether this is a consequence of adding the Apache Response Time into the log file or whether this would always happen I'm not sure.
We then modified our own version of the agent request and put it on our own servers. The modification was to timeout after 7 seconds, always log the time it took for the request to complete, and if the response took 5 seconds or more to complete then log it with "WARNING" prefixed to the beginning of the log line.
We left our version of the agent running on our actual servers for a period of time and then went back to the log file and found that every now and again, it would take over 5 seconds to respond.
We found tool provided by Google, Google Lighthouse. We analysed our main site and our support portal with Google Lighthouse and found that we had a fairly low performance score. We also checked the network waterfall in Google Chrome Dev tools ensuring that it would request the site without using anything from local cache.
We did this several times, and most of the time the site loaded within a second, occassionally though the network waterfall would show the request sometimes take 3-4 seconds. With this info, and the Google Lighthouse tool we found that these latest timeouts aren't network related and instead with the code of our website and our support portal.
We made some modifications to the code, such as loading some of our javascript libraries using async where we could. Other libraries that were external such as Google Analytics we downloaded as a local script instead.
We also found that on our main website, we had social buttons to allow easy following of our Facebook and twitter accounts but found these were dramatically slowing the website load time. We've now therefore removed these and instead just added the branding icons with a link to each page.
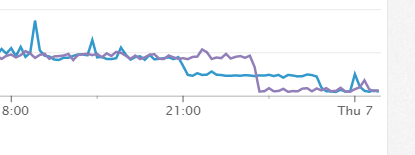
By doing the above we've seen load time drop by around 1 or 2 seconds. We also checked our datadog monitoring HTTP response metric and this also showed a drop in HTTP response time as shown below.
Conclusion
In conclusion, we believe we have finally resolved the issue. The first issue that we had was definetely network related with our previous hosting provider. The connectivity issues were previously several timeouts a day which we then stabilised by changing the TCP_FASTOPEN and TCP_TIMESTAMP settings. We also didn't agree with how load balancer was performing its health checks and closing the connection by aborting instead of a graceful close (sending an RST packet), although this wasn't directly related to the issue but believe this is bad practice as it keeps the local socket open in TIME_WAIT using unnecessary resources. (If there are any TCP/Network experts would really like to hear your opinion in the comments on this).
Although possibly moving to a new hosting company was unncessary as the secondary timeouts were caused by a delay within the loading of the website resources, but with the above issues where we had to change TCP kernel settings to stabilise the settings (the settings were original settings provided by the hosting provider image) as well as issues with the way we saw the load balancer aborting the connection we're still happy that we moved to new provider.
Although this been a massive pain in the neck, and this caused our users issues whic hwe are seriously not happy about, we strive to make useful, and reliable apps and services and with this problem over the last couple of months this has not been the case which we are very sorry about.
The datadog monitoring that we are using has been invaluable in helping to diagnose and determine where the issue is and going forward we will be continuing with datadog to monitor response time and abnormalities in our infrastructure and for any new websites, web portals and use Google Lighthouse to check our performance score.
If you have any comments, suggestions or questions then please let us know in the comments.
Thanks
Chris Board
Boardies IT Solutions
Are you a developer or involved in Quality Assurance Testing or User Acceptance Testing, you might be interested in Test Track
A simple and affordable test planning and management solution.
Developed by Devso