Devso Blog
Latest news and developments from Devso, including progress updates on the development of Crash Catch (https://crashcatch.com) and future projects
CritiMon - Viewing Crash Details (Part 3)
Chris Board
Jan 20, 2019 • 9 min read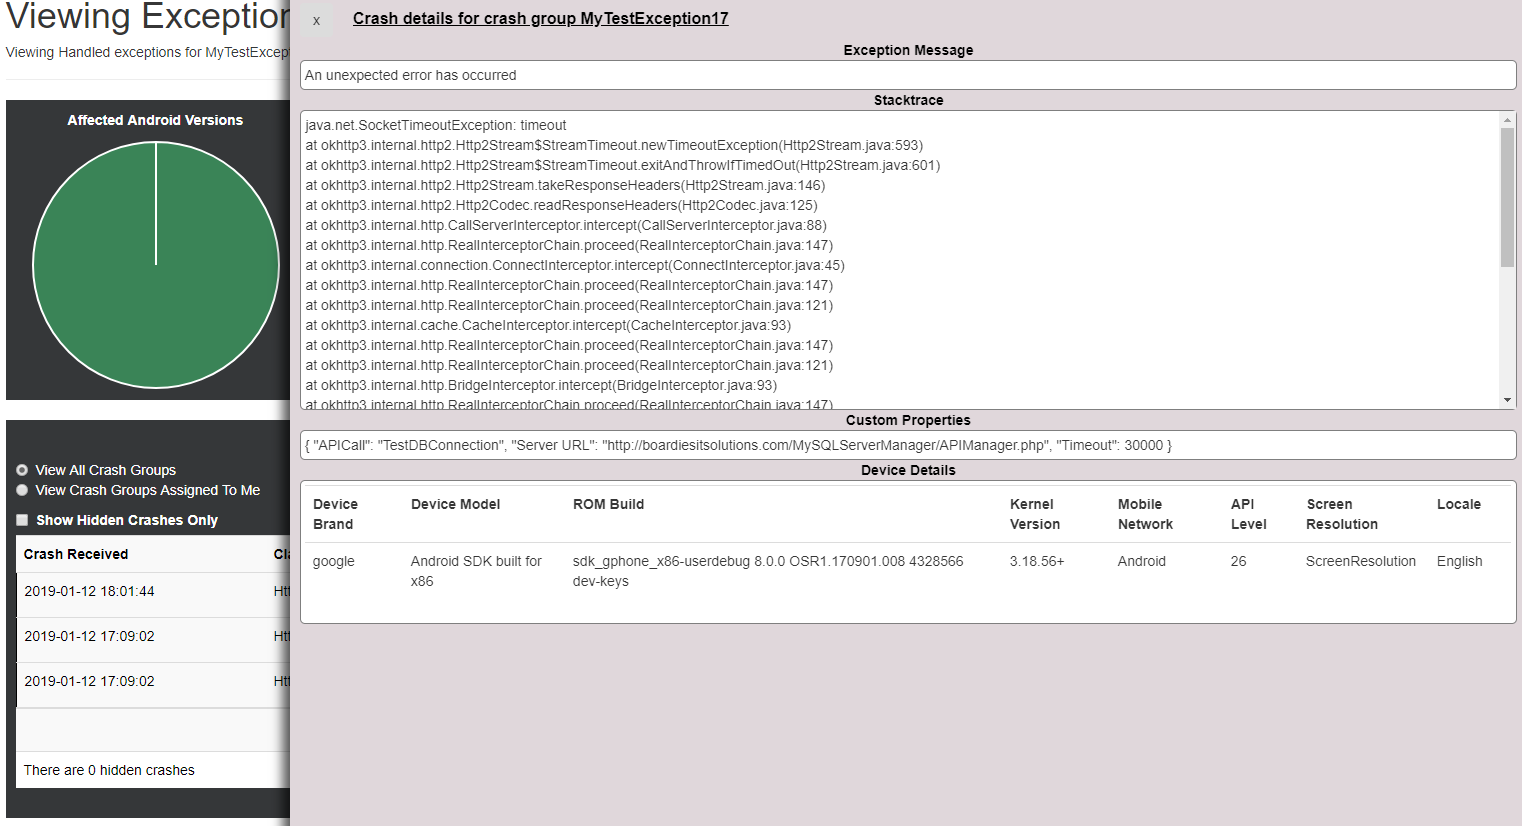
This is the third post regarding our new Crash Monitoring platform "CritiMon", coming as an early access preview in Q1 of 2019. In the last post we explored registering your applications with the platform - including being able to create your own SDK for languages and/or platforms we don't yet officially support yet. In this post, we will be looking at how to view and manage the crashes and errors that you receive from your software and/or web applications.
Once you've registered your app with CritiMon, you are then able to add the SDK to your application or web service, then in its simplest form call CritiMon.Initialise("<your_app_id>", "<your_api_key>".
Doing the above is the bear minimum you need to get crash data - but this will only tell you about fatal unhandled crashes. For example, it will capture crashes such as the below bit of pseudo code:
TextBox myTextbox = null;
myTextbox.setText("Hello World");
The above pseudo code would cause a fatal exception, depending on the language it might be a NullPointerException. This would cause your app to force close and the user would have to start again. These are the most important crashes that you want to avoid ever happening, and these types of crashes will be caught and reported on with just the single line above.
But what about exceptions that occur - that shouldn't happen but you handle them to tell the user something has gone wrong, you might not want to report on all of these type of errors, but there may be some that you do. This is where you can call Critimon.ReportCrash(exceptionObject, severity, params);
CritiMon.ReportCrash() can be used anywhere, all you need to do is create an exception object and pass to the method (params is optional), although this would usually be done in a catch handler, an example pseudo code is below for this:
try
{
	TextBox myTextbox = null;
	myTextbox.setText("Hello World");
}
catch (Exception ex)
{
	CritiMon.ReportCrash(ex, Severity.Critical);
}
The above code will still throw a NullPointerException (or equivalent depending on language) but instead of crashing your app, the catch exception handler will be triggered and in this, CritiMon.ReportCrash() is being used and passing in the exception object.
The data collected will be more a less the same as if it was an unhandled crash, except you can control what you report on, and you can handle the issue for the user, whether you show an error to the user, to retry after a set time.
As mentioned earlier, the ReportCrash method can take an optional parameter. This is a JSON object (might differ depending on language) where you can specify key/value pairs to gain more information about how that crash might have occurred. You won't need to include platform or OS specific information as that is already collected but lets say you were making an API call and your app threw an exception. You could in theory send some JSON data to include certain attributes such as the API URL, the API method and what the response from the API was to help you diagnose what caused the fault.
Below is a list of the common things that CritiMon collects for a crash or exception, note however, that the below list is not a concrete list as it is dependant on platform
- The severity (if it is an unhandled exception severity will always be Critical, for handled exceptions where you pass the exception object you send the severity with the exception object)
- Exception Type (e.g. NullPointerException)
- Screen Resolution (if available)
- Kernel Version (if applicable)
- Locale (if available)
- Device Model (Platform Dependant)
- Crash Type (Handled or Unhandled e.g. from CritiMon.ReportCrash method or from unhandled exception handler)
- Custom properties (if you pass the optional parameters in the report crash)
- Stacktrace (if available)
- Apps Version Number
- Exception Message
- Class name (if available)
- Line no (if available)
So now that you have your app registered with CritiMon, you've released it out to your users, you now want to keep any eye on things and make sure your users aren't experiencing any issues, and if anyone is, you want to make sure you can fix it as quickly and easily as possible. When you first sign in to CritiMon, you will be shown your registered apps list - this was shown in the previous post but we'll show it below as there's some important information that you can use at a glance to see which of your apps or reporting crashes.
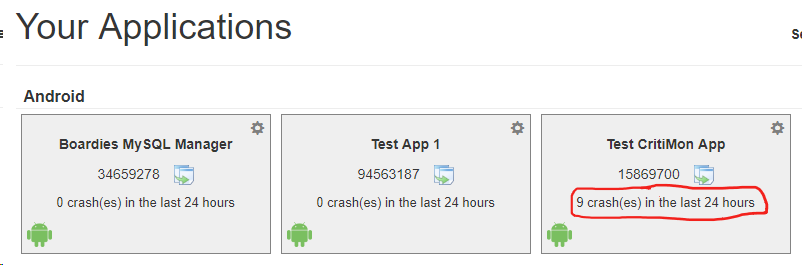
App List Registered Crashes
As you can see above, it shows you how many crashes have been received per an app in the last 24 hours, so you can quickly see at a glance which apps need to be looked at.
When you click on the app, you will then see app the details, such as the number of daily active users, the number of crashes received and then the crash details. Each detail is explained below along with screenshots.
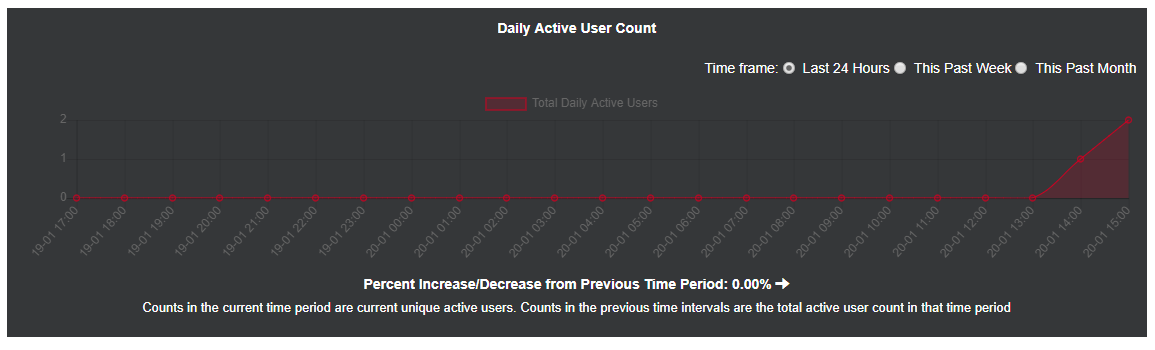
Daily Active Users
The daily active users shows the number of apps that have registered with Critimon and can be shown in the periods of the last 24 hours, the past week and the past month. When changing the time periods of how it should be displayed, you will also be shown underneath the percentage increase/decrease of active users from the previous period so you'll be able to see if you've had a number of crashes whether this has had an impact on the number of users using your app or web service.
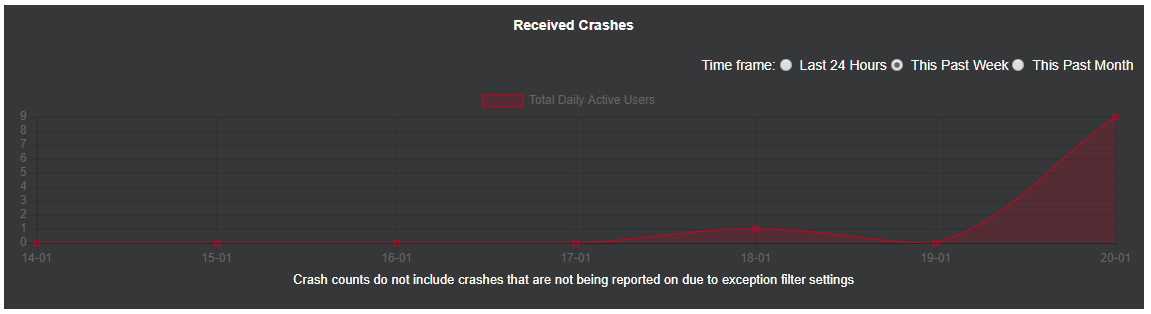
Crashes Received
In the graph above you can see the number of crashes that have been received by the app in the last 24 hours, the past week or the past month. This will help to show if there's suddenly a spike in new crashes and you'll be able to tie it up with a release.
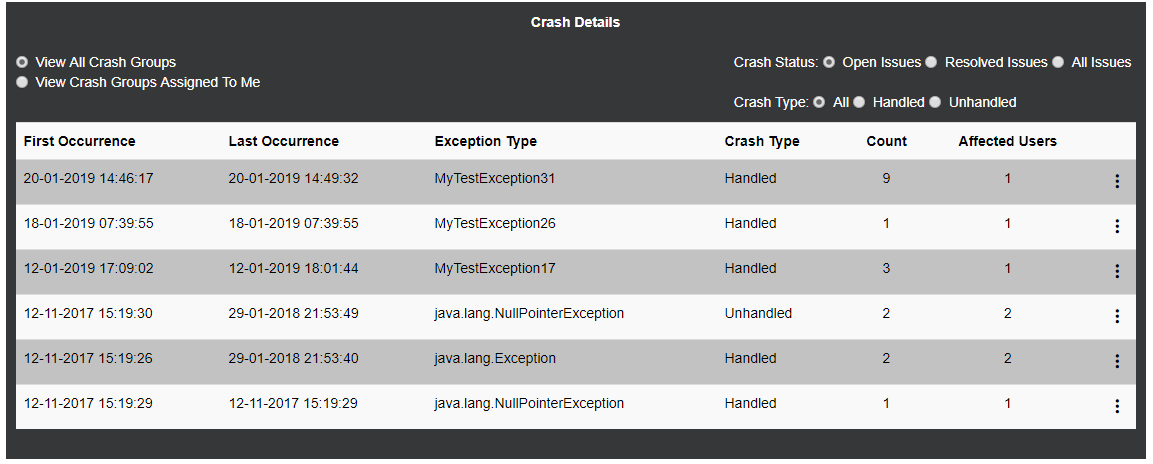
Crash Group Details
The above is the most important part, as it doesn't really matter how many crashes you can see you're getting if you can't see what the crashes are :).
In this table, you can filter to only show unhandled or handled crashes or both, only view open crashes or resolved crashes or both and view all crashes or crashes that are only assigned to you.
The crash group table provides information as to when the crash first started to occur, when it last occurred, what the exception type was, e.g. NullPointerException, whether the crash was handled or not, i.e. was it a crash being sent from CritiMon.ReportCrash or was it from the unhandled exception handler, the number of times the crash has occurred, and the number of affected users. (The affected users is established from a device id. This is a randomly generated device id - the user can't be - and nor should they be tracked via this device id), and the on the right hand side of each crash group is a context menu to help manage the crash, we'll get more info on that in the next post.
When you click on a crash group, you will be taken to view the details of that specific crash group.
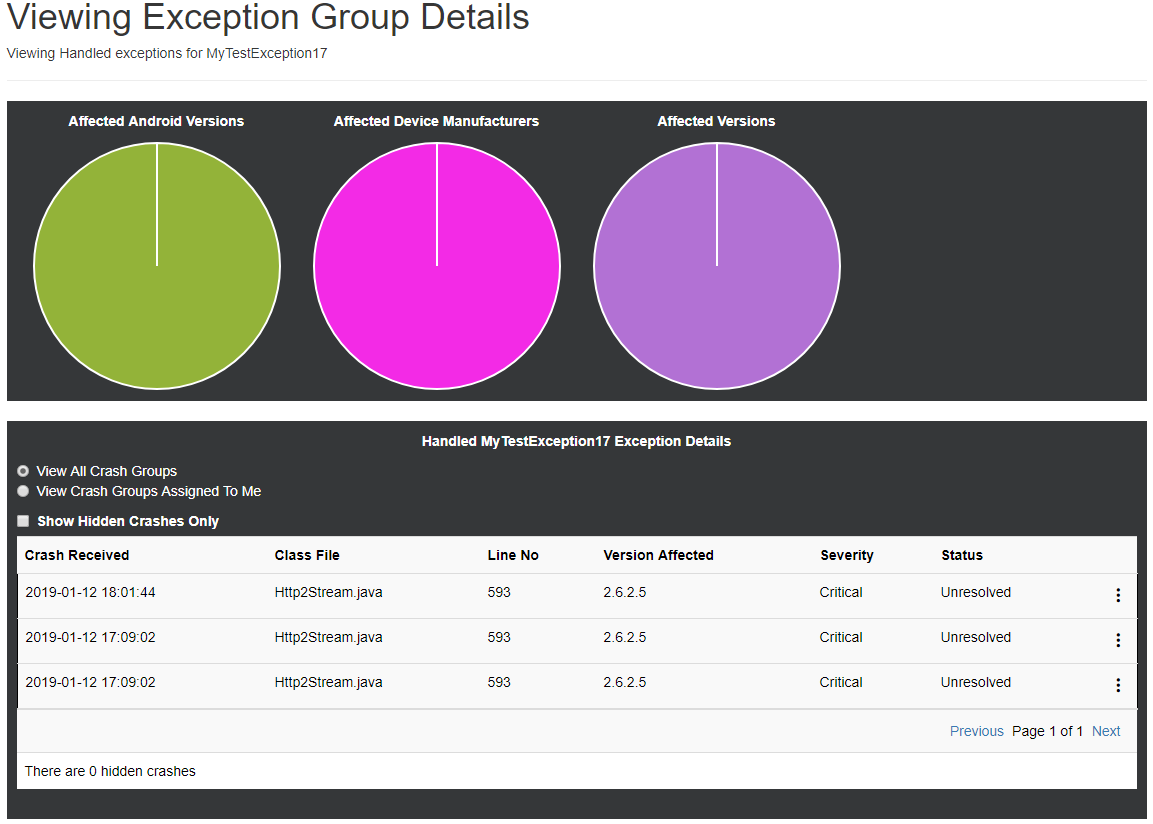
View Crash Group Details (Android)
The above screenshot might differ slightly based on the language and the platform being used but this shows the individual crashes that have occurred for the selected crash group. The pie charts at the top will be language and platform dependant, but they'll give an indication of the affected versions, affected operating systems where applicable etc.
In the table below the pie charts, is each individual crash that occurred, when the crash occurred, the class file that triggered it, the line number and the version number as well as the severity that you indicated (unless it was an unhandled crash in which case it will always be critical) and the current status of the crash, and again there is a context menu icon next to each crash to help you manage the crash - and again, there will be more information on that in the next post.
When you click on an individual crash, you will then get to see the specific crash details as shown in the screenshot below.

Crash details - side bar open
In the above screenshot you can see that once we've clicked on a crash, a side panel opens up with the details about the crash. This includes things such as the exception message, the full stack trace, any custom properties you've specified (if it was a crash via CritiMon.ReportCrash) and the device details that triggered this specific crash. Using this information you should be able to easily establish where the problem occurred and be able to fix it and release it as quickly as possible.
That's it for this post, hopefully this gives you a general idea of how crashes are shown and how it can be used to help fix any bugs in your applications and/or web services. In the next post, we will be looking at the more advanced features of the crash management such as assigning users, receiving crash alerts, filtering what crashes should be reported on and making development notes about a crash.
To view the other posts about Critimon, then please click here. We'd love to get your feedback on this so if you have any questions, comments or ideas of what you would like to see, then please let us know in the comments or reach out to us by sending us an email to [email protected] with the subject "CritiMon".
Also, don't forget if you sign up your interest in the platform at https://critimon.boardiesitsolutions.com you will be given an early access preview including 50% off our paid plans.
Are you a developer or involved in Quality Assurance Testing or User Acceptance Testing, you might be interested in Test Track
A simple and affordable test planning and management solution.
Developed by Devso